

We express our deepest sympathies to all those affected by the earthquake centered in Kumamoto Prefecture.
Immediately following the 2026 Kumamoto Earthquake, Synspective conducted emergency observations using its small SAR satellite StriX and has sequentially provided the acquired data and image-interpretation results to relevant organizations (see our previous post here). As a follow-up, this article reports the results of a crustal deformation analysis using observation data from “ALOS-2,” the L-band SAR satellite operated by the Japan Aerospace Exploration Agency (JAXA).
Analysis Summary
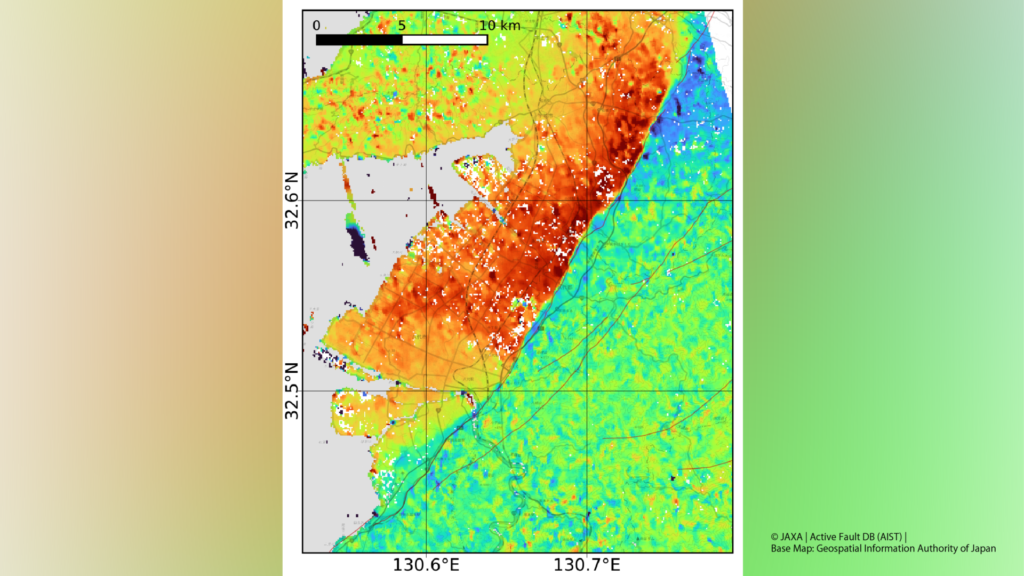
For the 2026 Kumamoto Earthquake (JMA magnitude 7.1; maximum seismic intensity of 7 on the JMA scale), which occurred at approximately 4:27 PM JST on July 28, 2026, we performed SAR interferometry (InSAR) and pixel-offset analysis using ALOS-2 data acquired at 11:30 PM JST the same day — about seven hours after the earthquake — paired with archive data acquired 350 days earlier, on August 12, 2025.
These results are consistent with the analysis published by the Geospatial Information Authority of Japan (GSI) and with the crustal deformation measured by GNSS (Global Navigation Satellite System).
*InSAR derives spatially continuous surface displacement from the phase difference between two SAR images acquired at different times. Pixel-offset analysis estimates larger displacements, such as those near a fault, by measuring the positional shift between two images, separated into the range and azimuth directions.
ALOS-2 Data Used
| Item | Details |
| Satellite / Sensor | ALOS-2 |
| Path / Frame | 124 / 680 |
| Beam | U3-11L (incidence angle approx. 48°) |
| Orbit direction | Ascending |
| Pre-earthquake observation | August 12, 2025, 23:30 (JST) |
| Post-earthquake observation | July 28, 2026, 23:30 (JST) |
Analysis Results
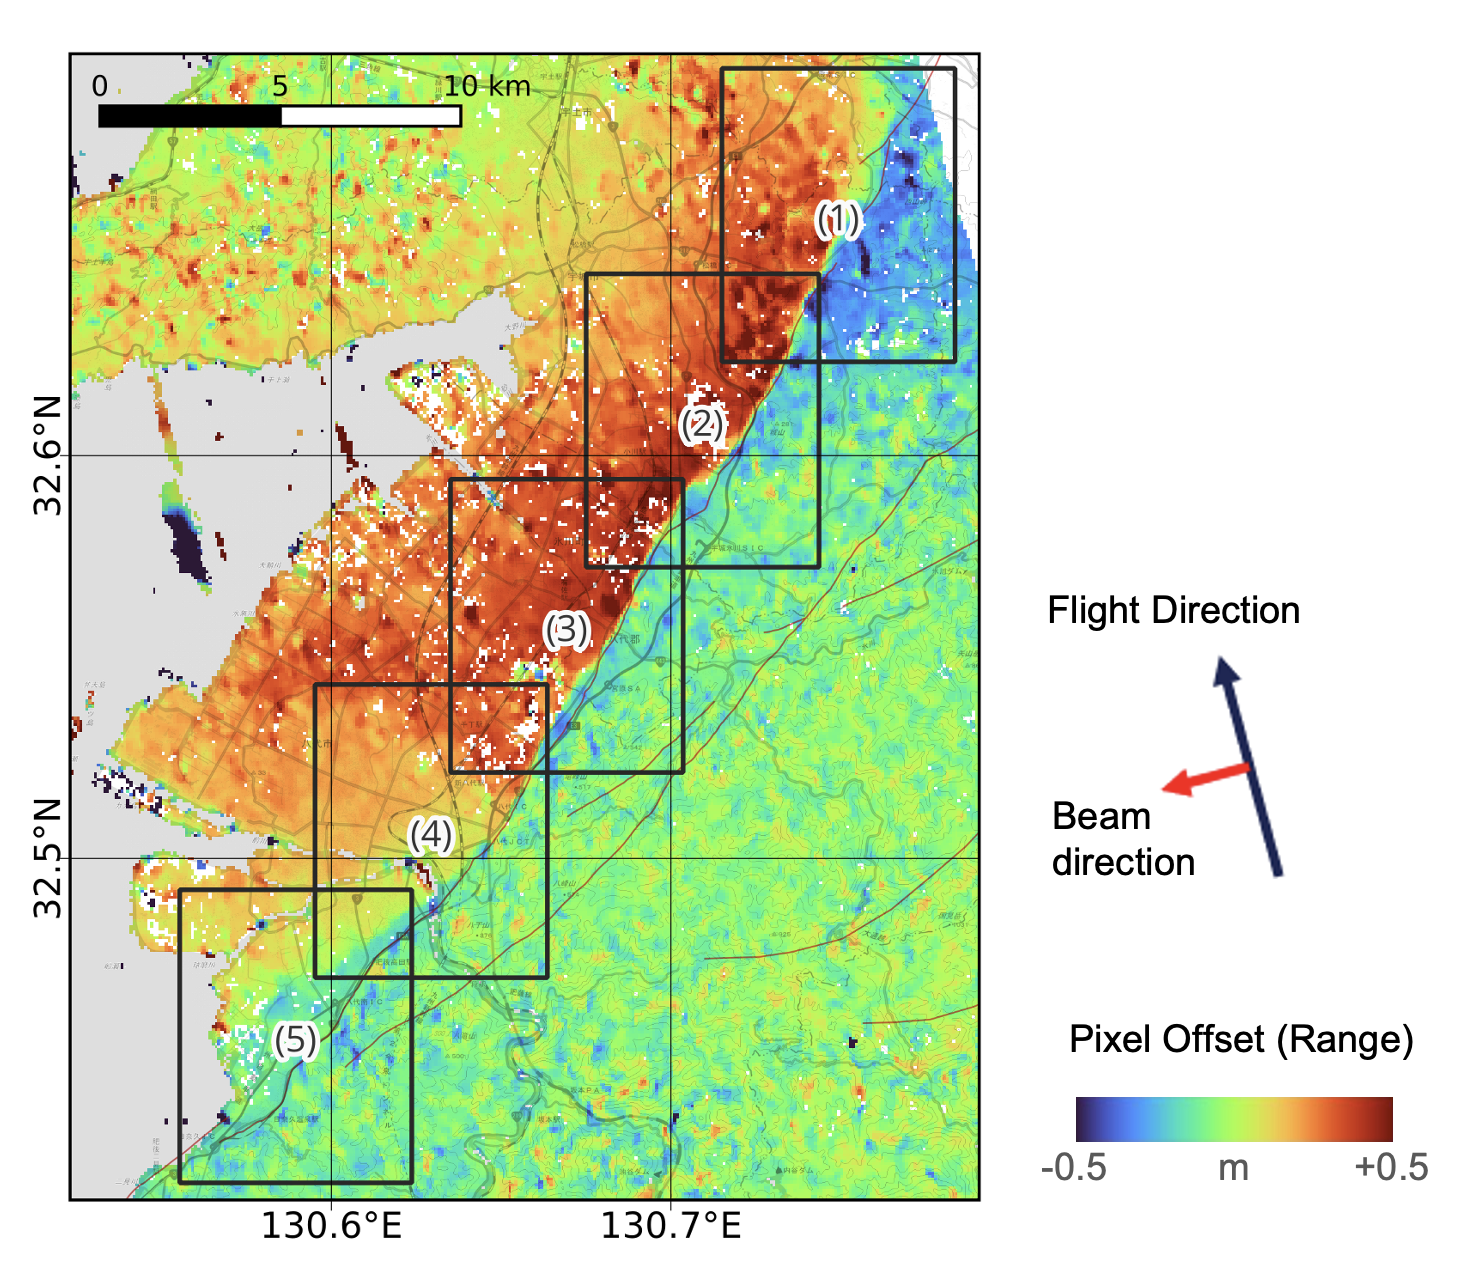
Wide-area map (a): Pixel offset (range) across the epicentral area, covering the region that includes the Hinagu Fault Zone. Boxes (1)–(5) indicate the extents of the corresponding enlarged views, and the arrows show the satellite’s flight and illumination directions.
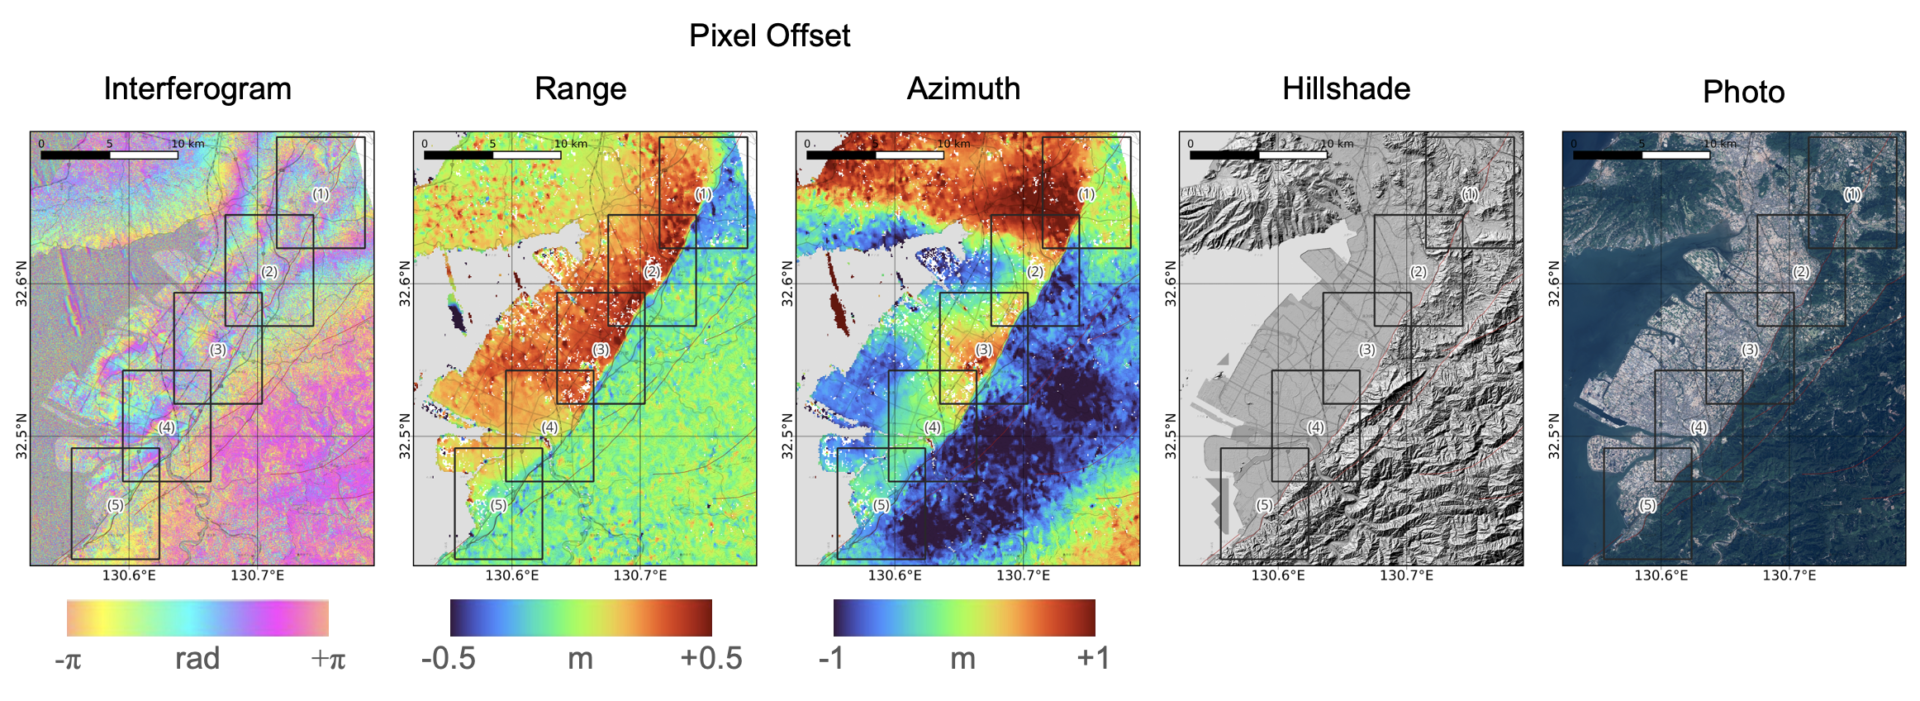
Wide-area map (b): A side-by-side comparison over the wide area of the interferogram, pixel offset (range), pixel offset (azimuth), shaded relief map, and optical image. In addition to the range component, the spatial distribution of displacement in the azimuth direction can also be examined.
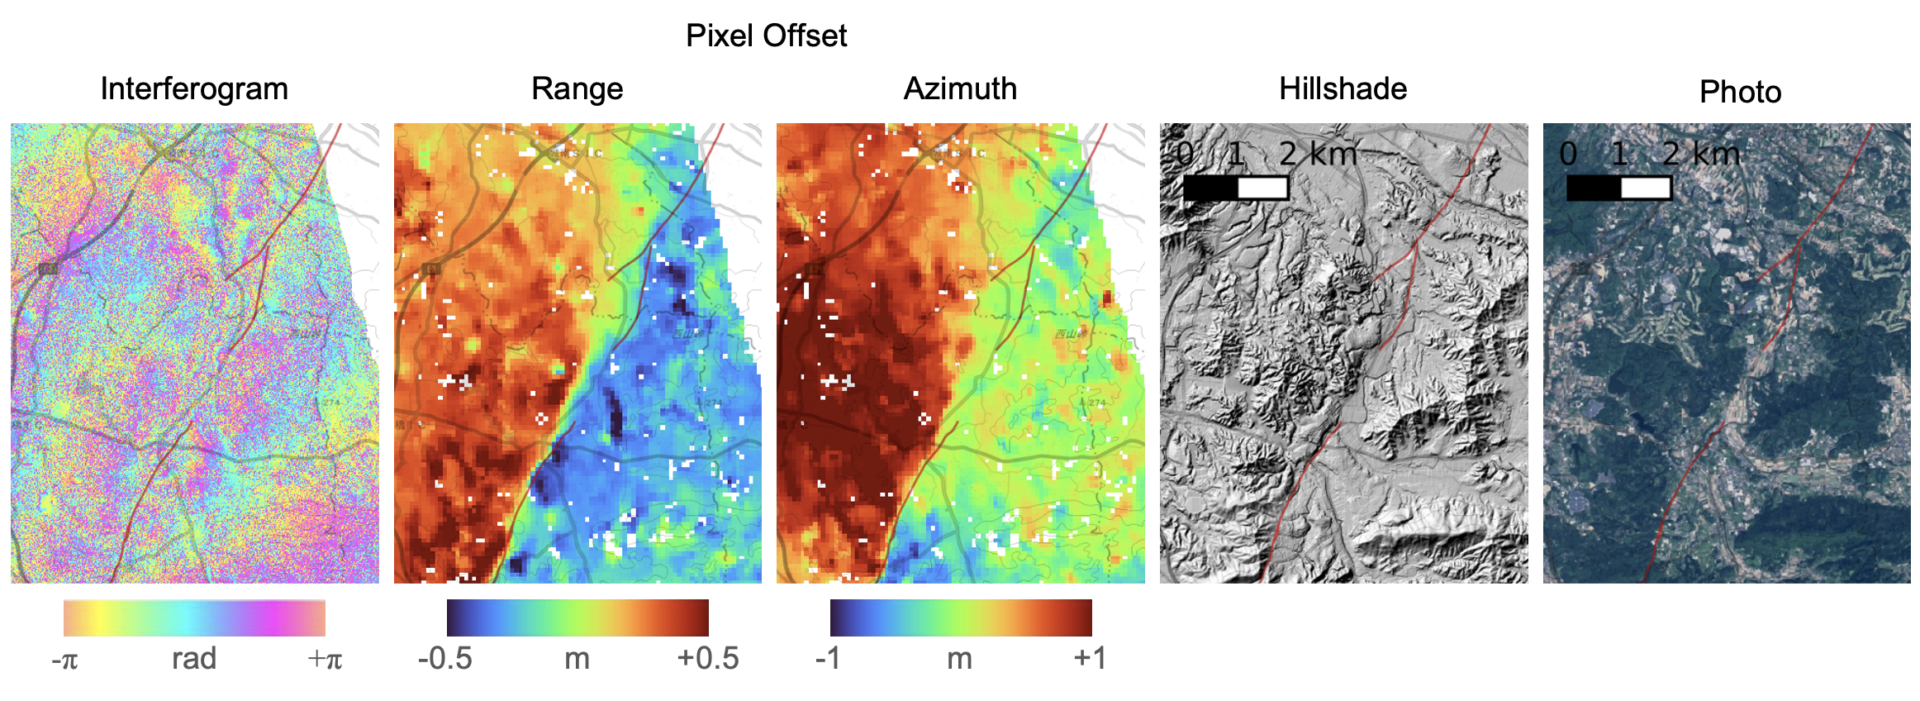
Enlarged view (1)
Enlarged view (2)
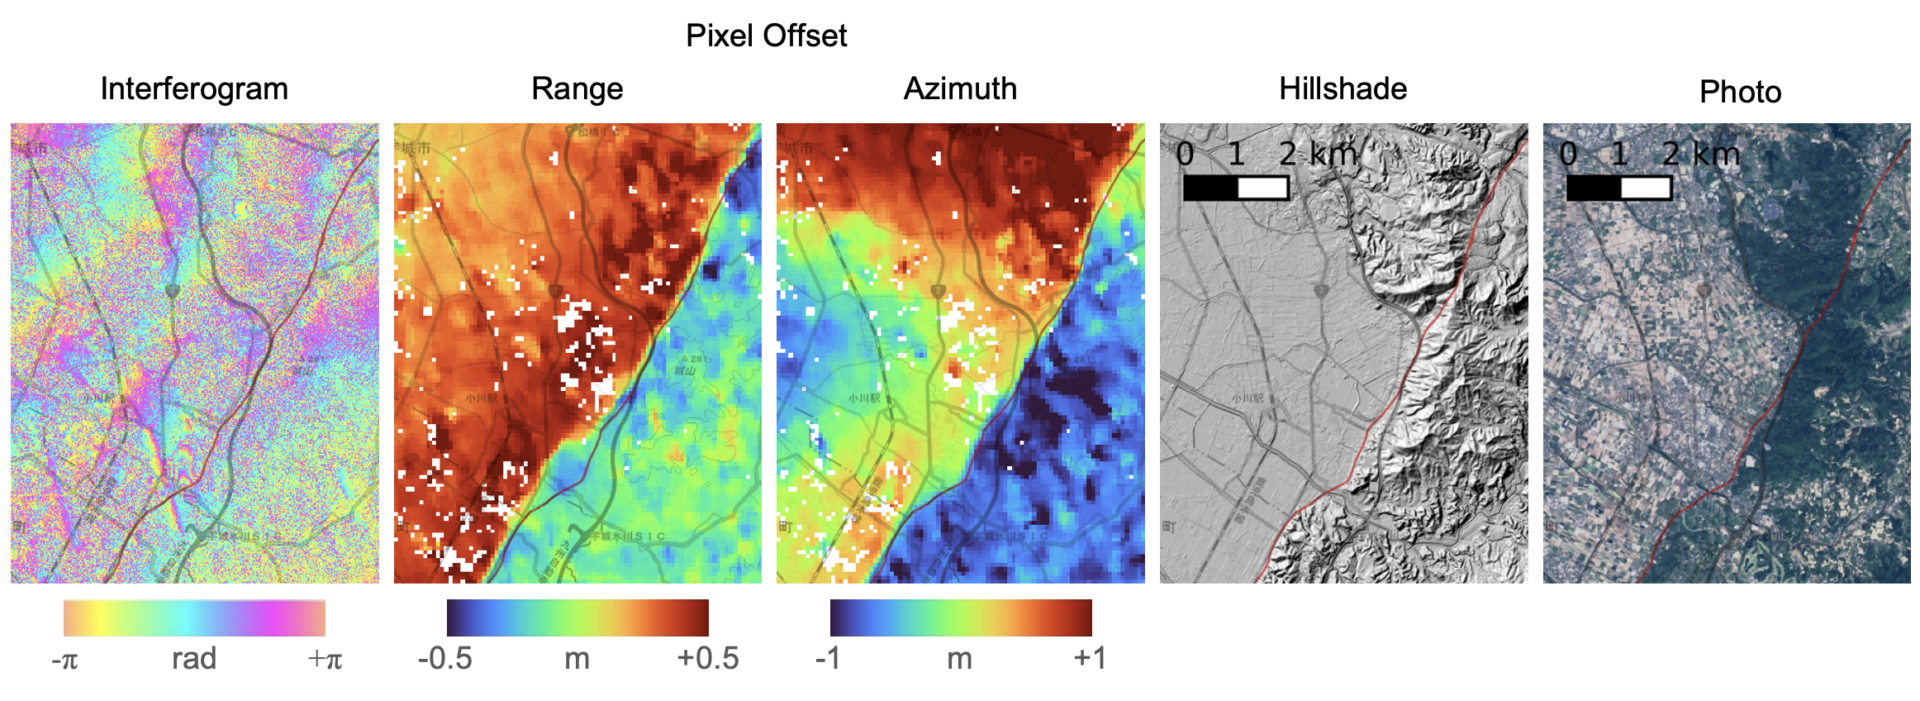
Enlarged view (3)
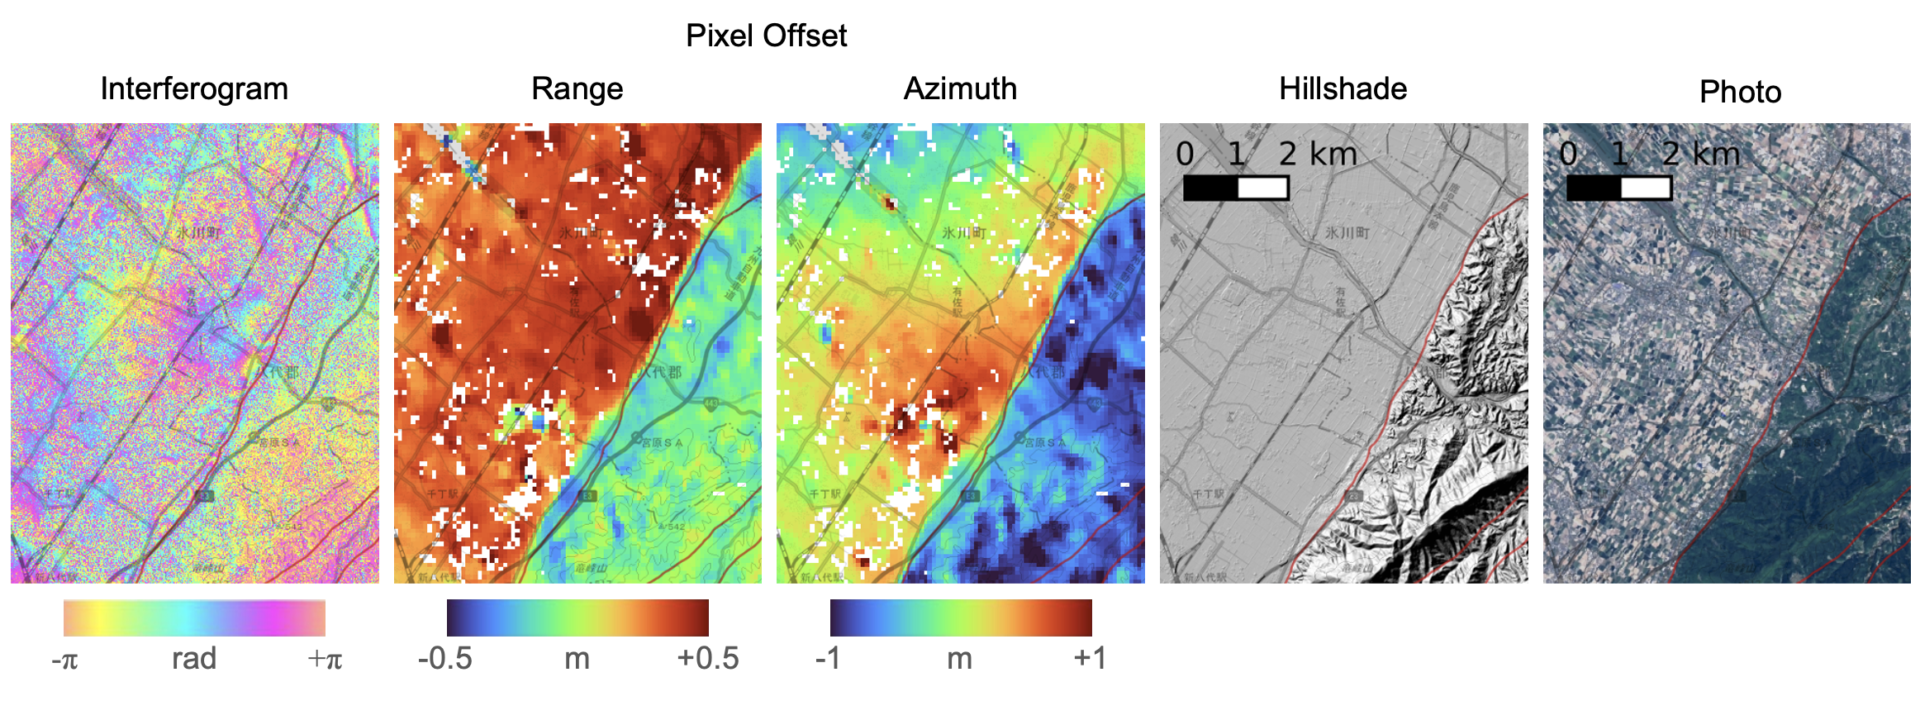
Enlarged view (4)
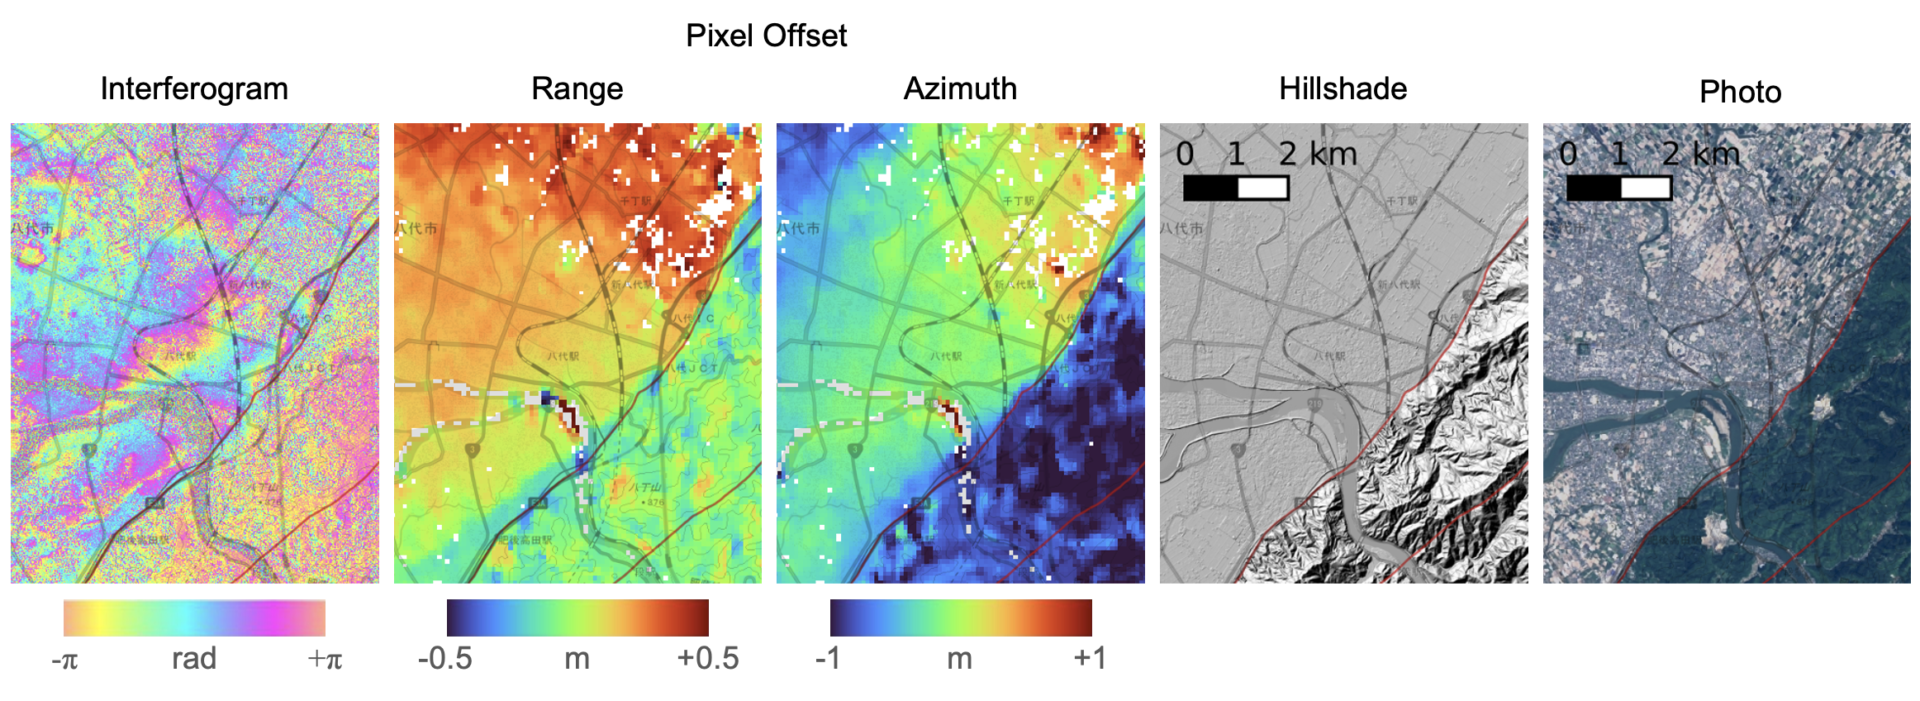
Enlarged view (5)
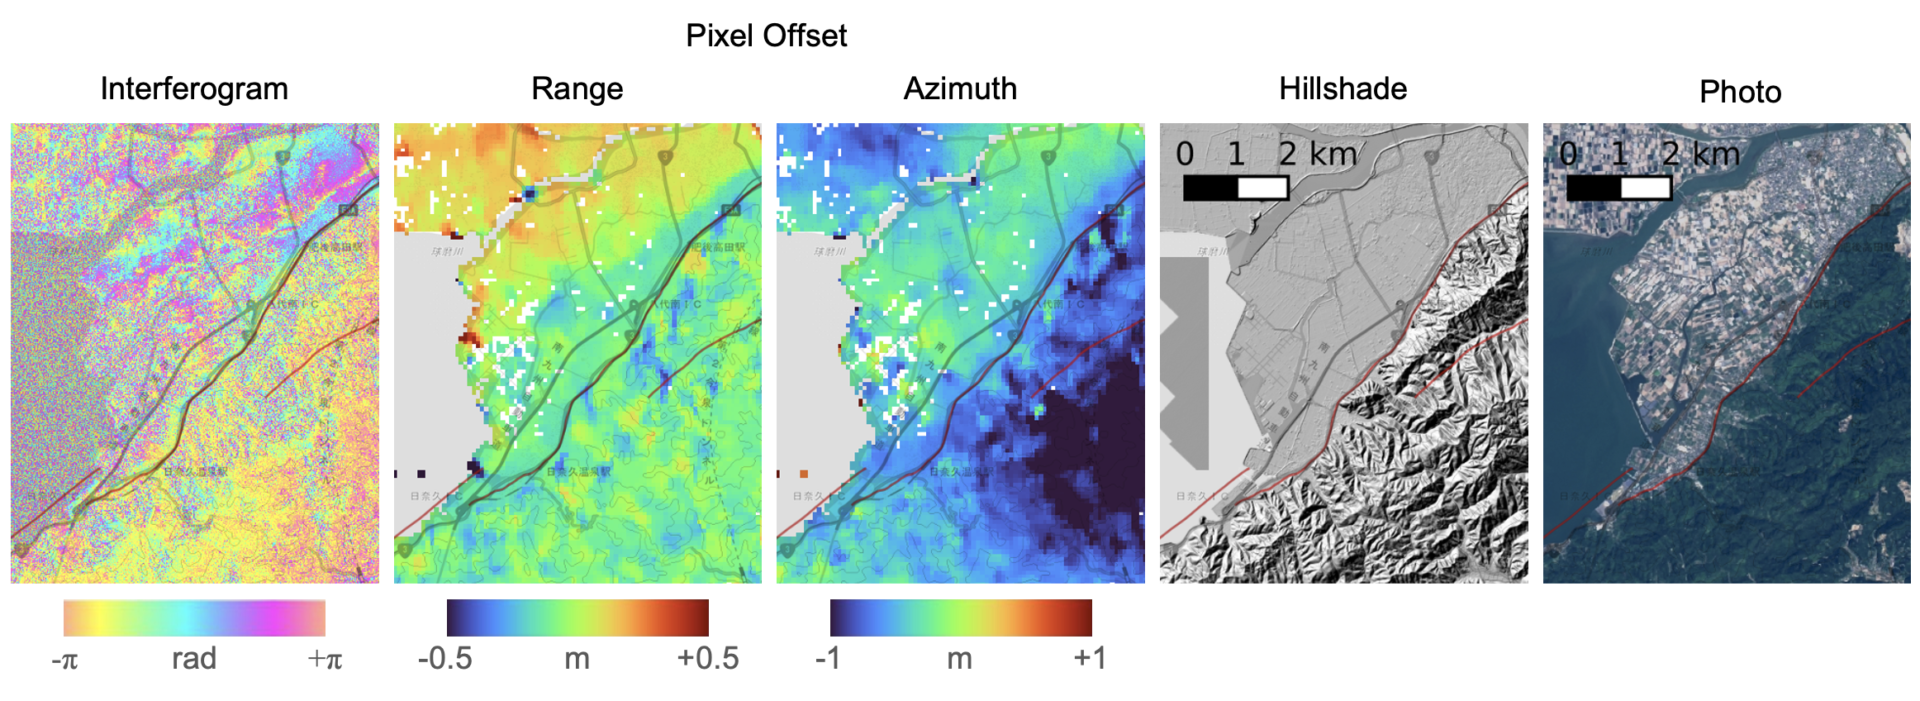
How to Read the Figures
Interferogram: The phase difference is shown as positive for motion away from the satellite (westward or subsidence) and negative for motion toward the satellite (eastward or uplift). Some areas include residual interferometric (fringe) effects.
Pixel offset (range): Positive indicates motion toward the satellite (eastward or uplift); negative indicates motion away from the satellite (westward or subsidence).
Pixel offset (azimuth): Positive indicates the satellite’s flight direction (north-northwest). These results strongly include errors attributable to the ionosphere.
Aftershocks continue in the affected areas. Please prioritize your safety, and we sincerely pray for everyone’s safety and a swift recovery.
From emergency observations by our StriX immediately after the earthquake, to the crustal deformation analysis using SAR interferometry and pixel-offset presented here, Synspective has supported disaster response across both observation and analysis. Leveraging these comprehensive observation and analysis capabilities together with our rapid response, we will continue to collaborate with public institutions and other relevant organizations to provide rapid, continuous information at every stage—from assessing the extent of damage through recovery and reconstruction.
<Sources / Data Credits>
SAR data: © JAXA (ALOS-2 / PALSAR-2)
SAR interferometry & pixel-offset analysis/figure production: Synspective
Active faults (red lines): Active Fault Database, National Institute of Advanced Industrial Science and Technology (AIST)
Base maps: Geospatial Information Authority of Japan (GSI) tiles (pale-color map, shaded relief map, aerial photo)
<Reference Links>
ALOS-2 data (JAXA): https://www.eorc.jaxa.jp/ALOS/jp/dataset/open_and_free/palsar2_l11_l22_j.htm#Kumamoto_EQ_2026
Active Fault Database (AIST): https://gbank.gsj.jp/activefault/index
GSI map tiles list: https://maps.gsi.go.jp/development/ichiran.html
Crustal deformation associated with the 2026 Kumamoto Earthquake (GSI): https://www.gsi.go.jp/uchusokuchi/20260728kumamoto.html
Crustal deformation from continuous GNSS observation (GSI): https://www.gsi.go.jp/chibankansi/chikakukansi_20260728_kumamoto_2.html
Previous post (emergency observation with StriX): https://synspective.com/information/2026/kumamoto_earthquake/