


Background
The city of Joshimath, in Uttarakhand, India, is known for being a sinking town ([1], [2]). Its precarious location, flanked by two rivers and situated in an earthquake-prone zone at the foot of the Himalayas, makes it highly susceptible to natural disasters. The area is particularly prone to flooding and erosion events.
Inhabited by over 25,000 residents, the city faced a significant crisis in January 2023. Over 800 buildings developed structural cracks, posing serious threats to inhabitants’ safety. This situation led to the evacuation of hundreds of residents, who had to seek refuge in relief camps. The ongoing risk of landslides and earthquakes continues to keep the city’s inhabitants on high alert.
Overview
Synspective’s team, composed of experts in Interferometric Synthetic Aperture Radar (InSAR), conducted an investigation of subsidence trends from November 2016 to February 2023. They sought to identify potential precursor indicators based on the trend analysis. Given the observed combination of fast and slow land deformation over the past six years, the analysis was divided into specific periods, as illustrated in Figure 1.
For periods characterized by slow deformation, the team utilized Synspective’s Land Displacement Monitoring (LDM) solution for the analysis. Conversely, during periods of rapid deformation, the team employed the Differential InSAR (DInSAR) technique.
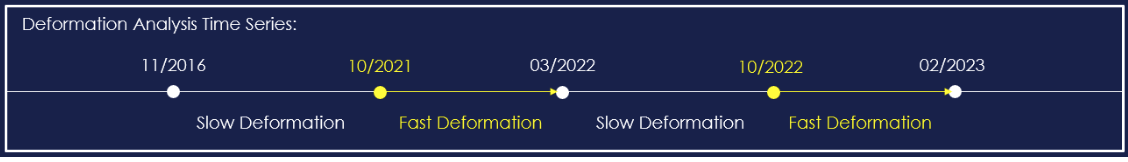
Figure 1. Overview of the deformation analysis time period.
Identified precursor points (points describing the onset of acceleration) were utilized in conjunction with rainfall data acquired from the India Meteorological Department (IMD) [3]. This combined data provided further insight into whether this information could have been potentially utilized as an early warning indicator, as detailed below.
Results
The results from the two periods of slow deformation, analyzed using Synspective’s LDM solution, revealed two distinct regional hot spots of deformation. These are illustrated in Figure 2, while Figure 3 presents the time series of the two distinct blocks. The high subsidence event that occurred in January 2023 took place in the western block, as indicated by the white marker.
However, initial observations from 2016 to October 2019 reveal a faster rate of deformation in the eastern block, with a rate of 5-10 cm per year (as seen in Fig. 3 b,d,f). In contrast, the western block displayed a slower deformation rate of 2-7 cm per year (as seen in Fig. 3 a,c,e).
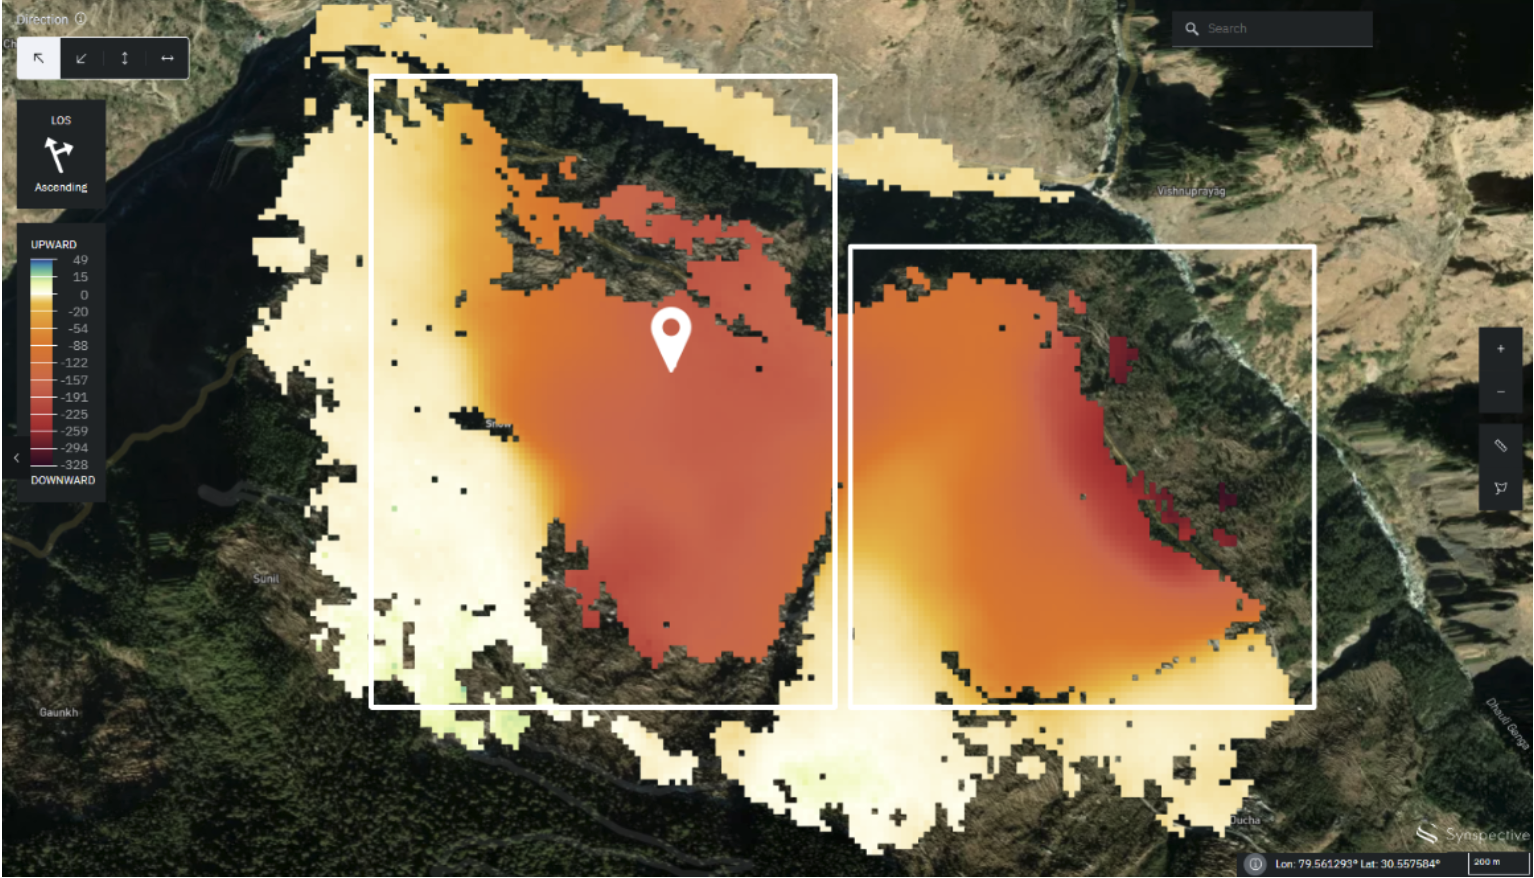
©Mapbox ©OpenStreetMap contributors | ©Copernicus Sentinel data [2016-2022] | ©Synspective Inc.
Figure 2. An overview of the two primary blocks of deformation, as identified through Synspective’s Land Displacement Monitoring solution, is provided. The deformation displayed corresponds to the period from March 2022 to November 2022. The eastern block, as indicated by the rectangle on the left, experienced deformation rates ranging from -4 to -10 cm per year. Meanwhile, the western block, marked by the rectangle on the right, underwent deformation at rates varying from -2 to -8 cm per year.
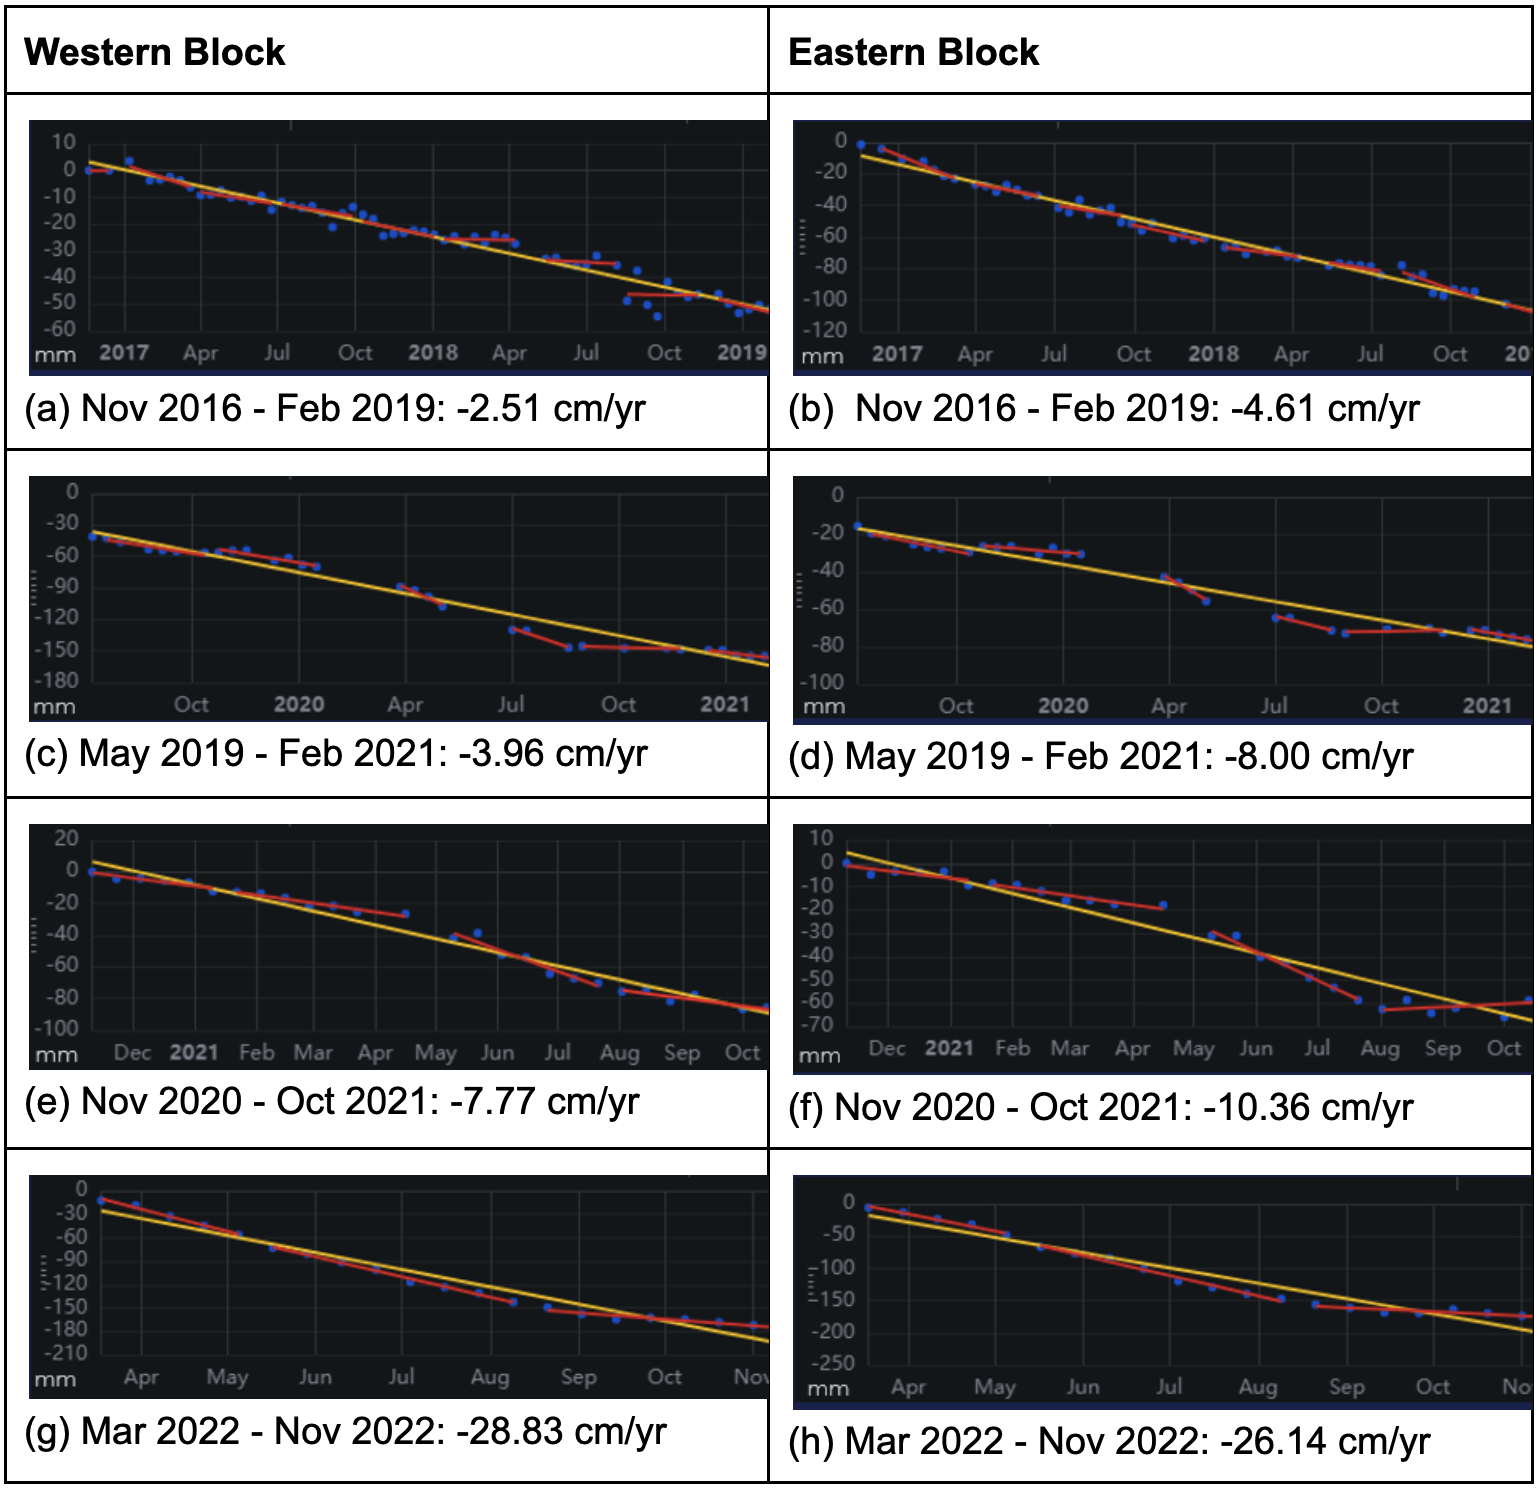
Figure 3. An overview of the land displacement results obtained through time-series InSAR analysis. The data for these results were extracted from Synspective’s LDM platform.
However, there was a noticeable spatial shift in subsidence rates from the eastern block to the western block in the summer of 2021. The western block began displaying higher subsidence rates. DInSAR analysis (Fig. 4a) conducted from October 2021 to March 2022 revealed that the western block experienced an acceleration in subsidence rates, reaching approximately 12.5 cm per month.
Following this period, the subsidence rate decelerated from March to November 2022 (as shown in Fig 2h) to -28.83 cm per year. Nonetheless, the subsidence rates in the western block have now surpassed those of the eastern block, which demonstrated a rate of -26.14 cm per year.
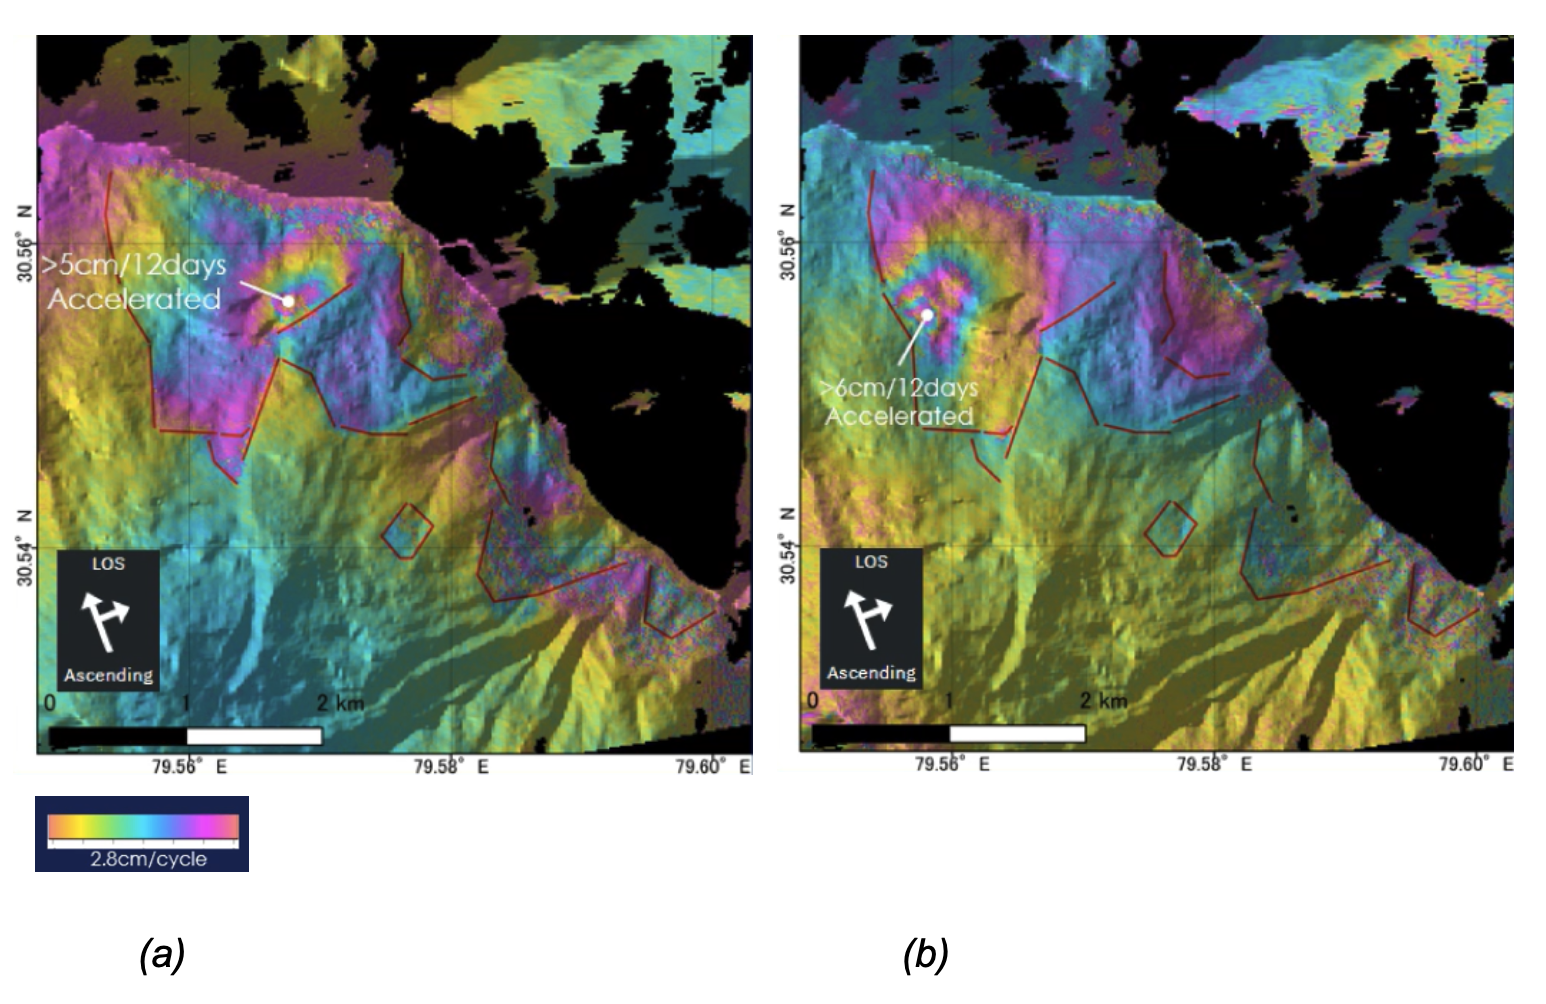
©Mapbox ©OpenStreetMap contributors | ©Copernicus Sentinel data [2014-2023] | ©Synspective Inc.
Figure 4. An example of DInSAR analysis showing a significant acceleration in deformation rates between (a) November 17 and November 30, 2021 and (b) November 13 and November 25, 2022.
Insights
To deepen our understanding of the displacement results, we identified precursor points utilizing the LDM results. These anomalous/precursor points describe the onset of acceleration. They serve as a useful and actionable indicator, potentially enabling an alert system to predict whether an area is on the verge of experiencing a series of high subsidence rates.
Figure 5 presents the mean monthly count of locations with anomalous displacement, along with the accumulated precipitation (mm) over a five-year period (2017 to 2021). A noticeable increase in anomalous points can be seen during the months of May, June, and July. This escalation is concurrent with the monosson season, which typically brings increased rainfall during June, July, and August.
Furthermore, the two major subsidence events and observed periods of rapid deformation occurred in October 2021 [4] and October 2022 (as noted in Fig. 1). These instances followed the build-up of increased anomalous points and rainfall. This correlation between displacement and heavy precipitation suggests that these combined factors could have been a potential tipping point for high subsidence.
Figure 6 illustrates the yearly averages of accumulated precipitation and counts of anomalous displacement points over a five-year period (2017 to 2021). We can observe a notable increase in anomalous points in 2020, with over 2000 anomalous points detected in July of that year. The first major subsidence event, characterized by the initial appearance of cracks in buildings, occurred in October 2021 [4]. This suggests that the interval between the onset of acceleration and the occurrence of structural failure can be more than 14 months.
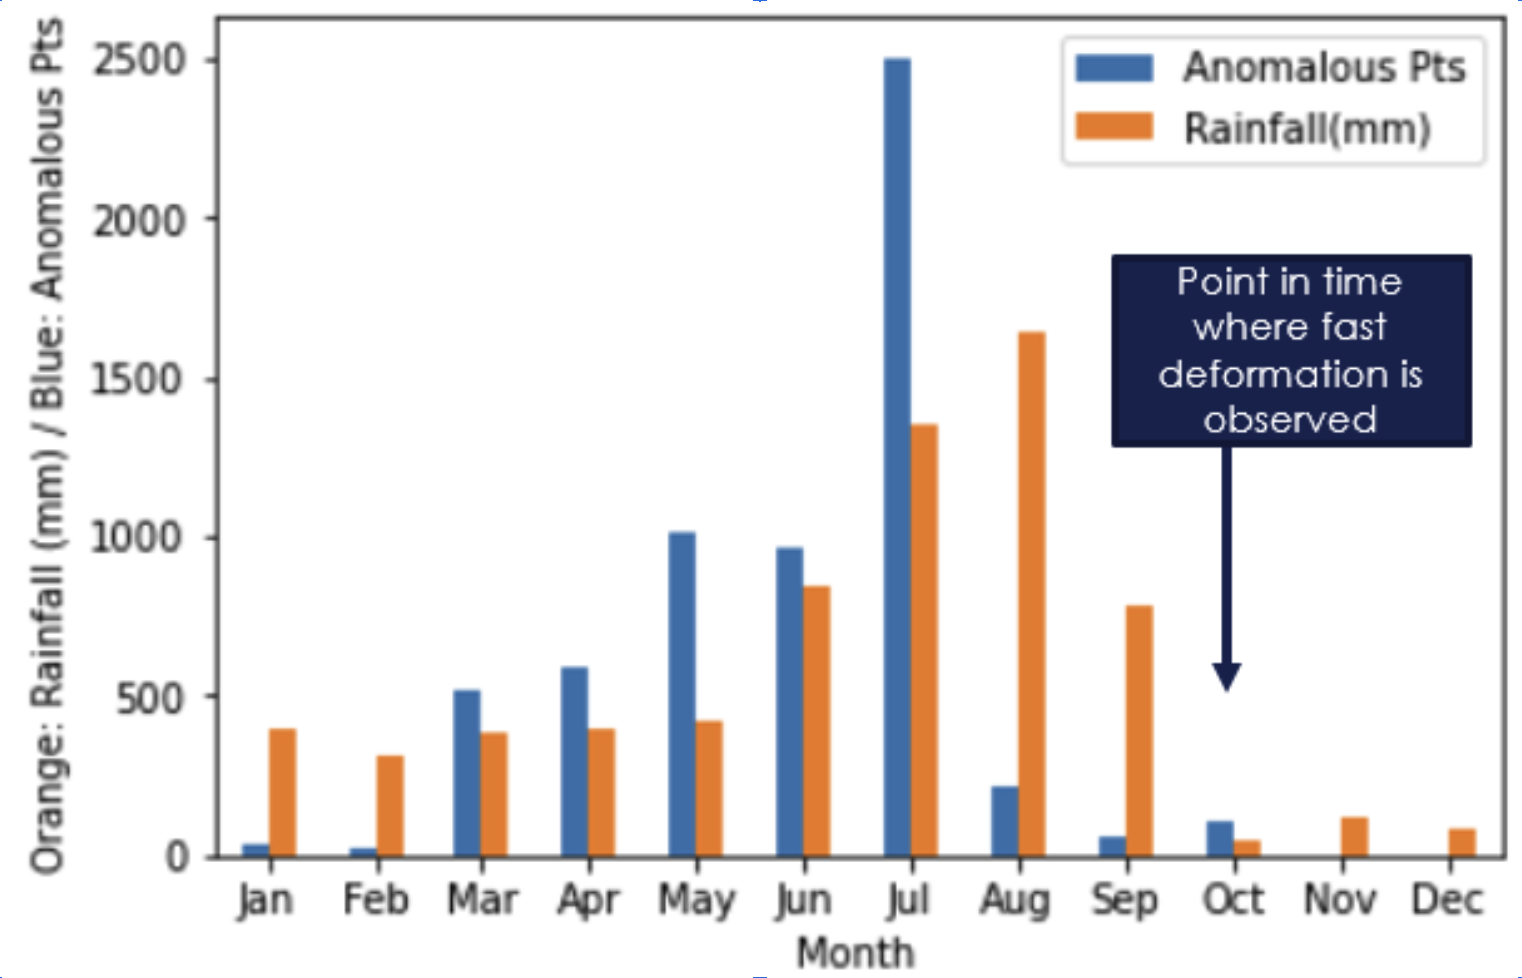
Figure 5. The histogram of rainfall (mm) (orange bars) and number of precursor/anomalous points identified (blue bars) from 2017 to 2021. The data is averaged on an annual basis.
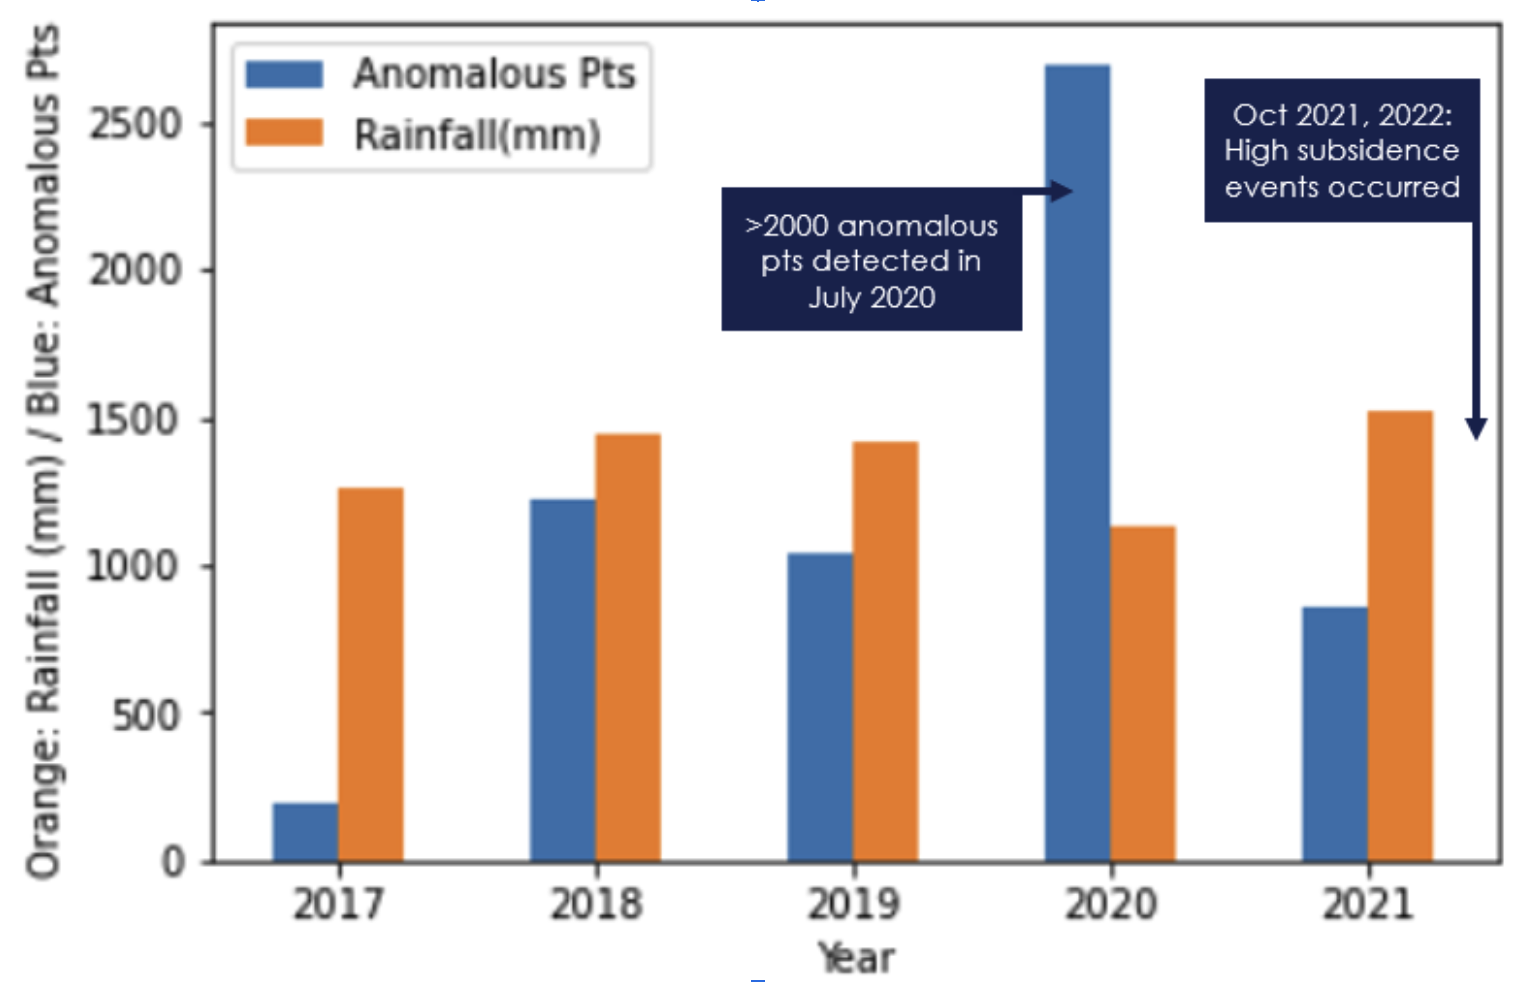
Figure 6. The histogram of rainfall (mm) (orange bars) and number of precursor/anomalous points identified (blue bars) from 2017 to 2021. The data is averaged on an annual basis.
Summary
The transition of the high land deformation regimes from the eastern to western block at Joshimath highlights the importance of consistent wide-area monitoring of subsidence prone locations. Regular monitoring facilitates comprehensive analysis and identification of critical patterns of land deformation in areas of interest. Additionally, it enables the distinct
identification of high-risk zones by analyzing subsidence patterns. Beginning in October 2021, accelerated subsidence rates labeled both the eastern and western blocks as critical locations. However, special attention should be directed toward the western block, as it currently faces slightly higher rates of subsidence.
Synspective’s proprietary precursor identification algorithm can extract anomalous points, indicating an acceleration in land movement. These points offer valuable clues into possible triggers of such acceleration. The exact reason for an increase in precursor points can only be identified by thoroughly investigating natural or anthropogenic events that preceded the increase. It’s plausible that a combination of events leading up to the increase in precursor points, together with the subsequent rainy season, triggered the abrupt collapse of Joshimath in January 2023.
For mitigation purposes, Synspective posits that the identification of a large number of precursor points, alongside knowledge of an impending monsoon season, could stimulate support for decisive action to mitigate this issue and/or plan evacuation procedures. As noted in [5], cracks in infrastructure in other areas such as Uttarkashi, Naintal, Gopsehwar, and Mussoorie have also been observed. However, surveys for land subsidence have not yet been conducted. Utilizing InSAR analytics such as Synspective’s LDM is a cost-effective method to convey such information to these areas.
We at Synspective believe that large-scale monitoring of urban infrastructure can significantly benefit from our SAR satellite data, ensuring smooth operations, effective resource allocation, and management. Our LDM service, which blends the power of InSAR, machine learning, and cloud computing, is designed to streamline processes, enable rapid decision-making, and alert authorities about detected anomalies in land deformation. With this approach, we are able to help cities take preventative measures and provide vital information to mitigate disasters in a timely manner.
References
[1] BBC News. “Joshimath: What’s the Future of India’s Sinking Himalayan Town?,” n.d.
[3] Pai et al. (2014). Pai D.S., Latha Sridhar, Rajeevan M., Sreejith O.P., Satbhai N.S. and Mukhopadhyay B., 2014: Development of a new high spatial resolution (0.25° X 0.25°)Long period (1901-2010) daily gridded rainfall data set over India and its comparison with existing data sets over the region; MAUSAM, 65, 1(January 2014), pp1-18.
[4] Upadhyay, Kavita. “Explained: Why Is the Land Sinking in Joshimath?” The Hindu, January 11, 2023.
[5] Shankar, Kartikeya. “Explained: Why Joshimath Is Sinking.” Outlook Traveller, January 16.
Author’s information
 Elizabeth Wong is currently a Sales Engineer at Synspective. She received her PhD in Physical Oceanography and Meteorology from the University of Miami and has a BEng in Electrical Engineering from the National University of Singapore. She has over 10 years of experience working with satellite remote sensing data and is always looking to further expand remote sensing applications in new areas.