

Overview
Synspective used a data analysis method combining SAR data analysis and optical imagery, which enables continuous monitoring over a wide area, to analyze operations in a parking lot at a famous theme park in Japan.
Possible Applications
By understanding traffic flow trends over a long term period, it is possible to efficiently manage parking lots, reduce congestion at the theme park and nearby shopping centers, as well as analyze markets and competitors.
In addition, the analysis method can be used in many other applications including vehicle and ship detection, ship navigation monitoring, and anti-theft protection.
Analysis Methods
In this analysis, we used SAR imagery and optical satellite images to identify and superimpose specific areas of the parking lot.
For SAR image analysis, we obtained and used data such as scattering intensity (*1) and coherence (*2) of radio waves. It is possible to analyze car movements and estimate traffic flows using data from the scattering intensity and coherence estimation.
(*1) Scatter Intensity: Microwaves emitted from the SAR sensor are scattered to detect physical properties on the Earth’s surface. Surface roughness has a large impact on scatter intensity.
(*2) Coherence: Microwaves emitted from satellites at two different times reveal the degree of coherence (ease of coherence) depending on the phase alignment.
Analysis Results

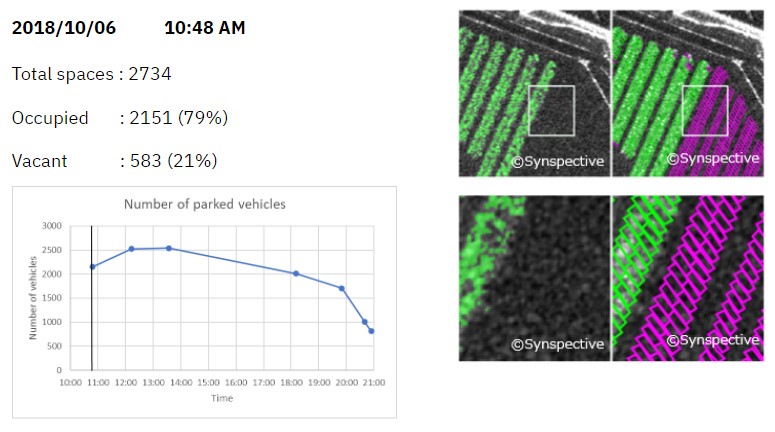
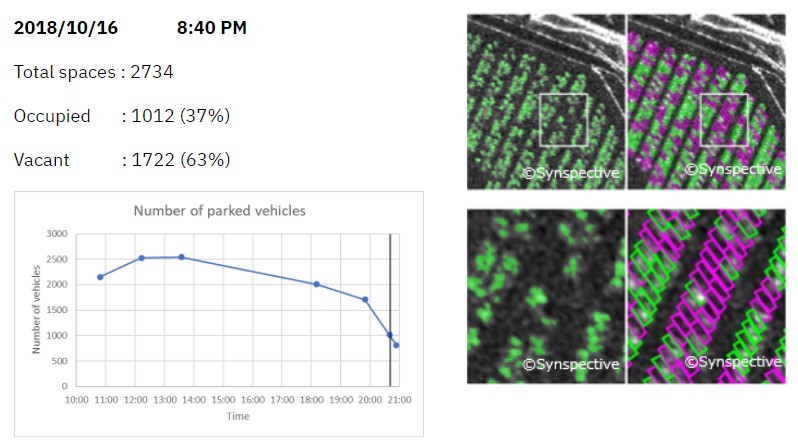
In the images below, we analyzed the number of parking spaces in chronological order. The left shows the analysis results from SAR satellite data and the right shows the combined results of parking frames detected from the optical data. The green imagery shows that the parking lot is full, and purple imagery shows that the parking lot is vacant.
The graph (left) and analysis results (right) for each time series are displayed below. The graph on the left shows the number of cars in chronological order. The vertical axis shows the number of cars and the horizontal axis shows data acquisition time.
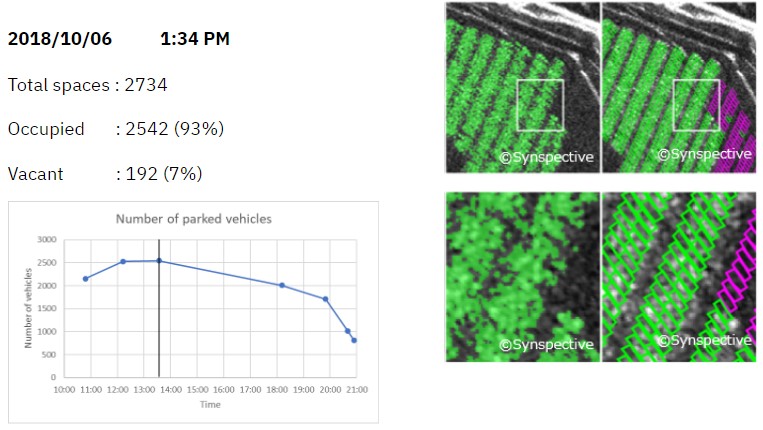
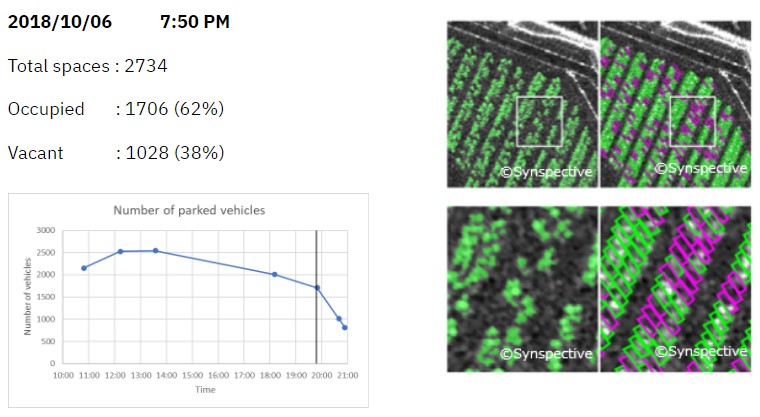
The second figure below (13:34) shows that it is the busiest time of the day with a 93% occupancy rate. The third figure (19:50) is at a 62% rate; however, in the fourth figure (20:40), the number of cars has decreased significantly.
It is possible to estimate the number of cars using only SAR satellite data. However, by combining SAR with optical satellite imagery, estimation accuracy increases and more detailed information, such as the number of occupancies, can be obtained and understood.
Conclusion
By using and combining fixed-point, time-series changes from SAR images and static position information (e.g., parking lot) that aid optical satellite analysis, we can understand vehicle trends and estimate traffic flow at each facility.
Synspective is developing and operating its own small SAR (Synthetic Aperture Radar) satellites. The company aims to build a constellation of 30 satellites by the late 2020’s, which includes one satellite already in orbit. With a full constellation in low Earth orbit, SAR satellites will be able to observe disasters anywhere in the world within two hours. Unlike traditional observation methods using optical satellites and aircraft / drones, SAR satellites are capable of all-weather ground observations, making it possible to quickly capture ground movements over a wide area.
January 2022 Analysis of the underwater volcanic eruption in the Tonga Islands, South Pacific
